The knockout round of the Women’s World Cup has arrived. After two weeks of group phase matches, the last 16 has been decided. All of the top nations made it through which has set up a couple tough looking matches. So let’s breakdown a couple of these matches and look how these teams progressed through to this stage of the tournament.
Canada
Canada made it through to the knockout phase after finishing second in Group E, after winning 2 matches and losing to the Netherlands. Let’s look at a quick summary of their tournament so far.
| match_date | Goals | xG | Total Shots | Shot On Target | Total Passes | Pass Completion |
|---|---|---|---|---|---|---|
| 2019-06-10 | 1 | 0.73 | 16 | 12 | 620 | 79% |
| 2019-06-15 | 2 | 2.44 | 22 | 15 | 663 | 83% |
| 2019-06-20 | 1 | 0.88 | 12 | 6 | 462 | 74% |
| 2019-06-24 | 0 | 1.04 | 11 | 5 | 558 | 76% |
| a Table 2: Summary of Canada throughout the group stage |
For the number of shots Canada have taken, they have been low on xG, or scoring probability. Whilst, against the two lower ranked sides, Cameroon and New Zealand, they played a high number of passes and an okay pass completion rate. If Canada are going to get passed Sweden in their last 16 match, they will have to create much clearer shot opportunities. Let’s take a look at their shots on target from against the Netherlands in their final match.
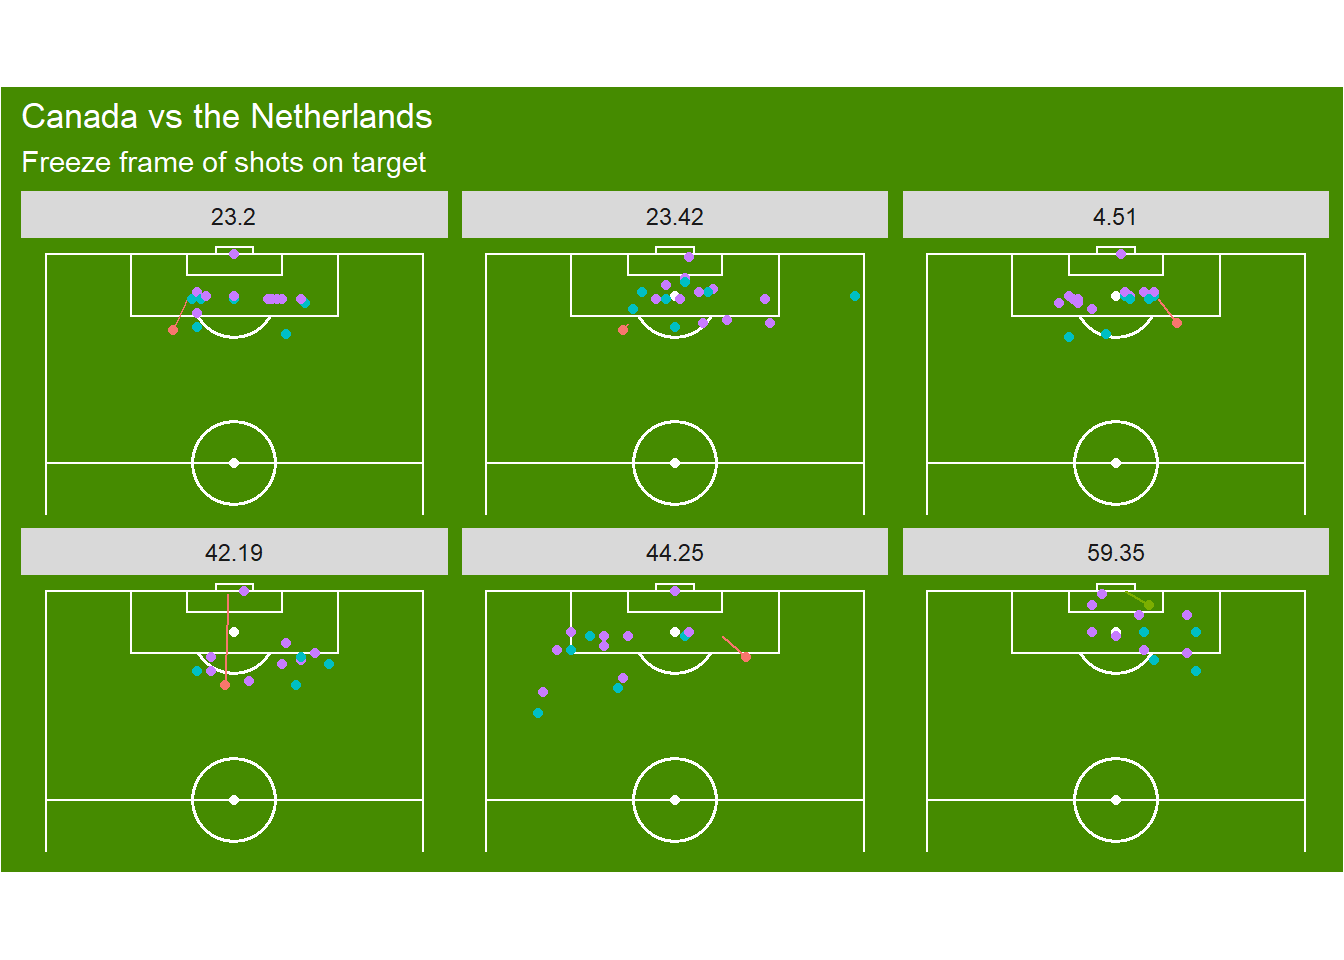
The plot above shows all of Canada’s shots on target, which I attempted to arrange by match time. We can see from this plot that Canada had two pretty good opportunities, one they scored and the other was saved. The freeze frame shows player positions at the time of the shot, rather than their end position. I am also only showing shots on target, to minimise the graph size shown above. For Canada to move on, they need to create better opportunities than what they did against the Netherlands.
Sweden
Sweden finished second in their group behind the United States, and will have an equally tough time against Canada in the last 16. In their first two matches they scored 7 goals from 50 shots and put up some high passing numbers. But, as we spoke about in my last post, passing isn’t everything and against the United States in their final match they had a tough time keeping the ball. So let’s take a look at their passing.
| match_date | Goals | xG | Total Shots | Shot On Target | Total Passes | Pass Completion |
|---|---|---|---|---|---|---|
| 2019-06-11 | 2 | 1.72 | 25 | 15 | 583 | 81% |
| 2019-06-16 | 5 | 2.80 | 35 | 21 | 661 | 86% |
| 2019-06-20 | 0 | 0.41 | 7 | 4 | 401 | 70% |
| 2019-06-24 | 1 | 0.57 | 8 | 3 | 384 | 70% |
| 2019-06-29 | 2 | 1.36 | 11 | 8 | 337 | 66% |
| 2019-07-03 | 0 | 0.43 | 11 | 8 | 501 | 66% |
| 2019-07-06 | 2 | 0.53 | 8 | 7 | 353 | 68% |
| a Table 2: Summary of Sweden throughout the group stage |
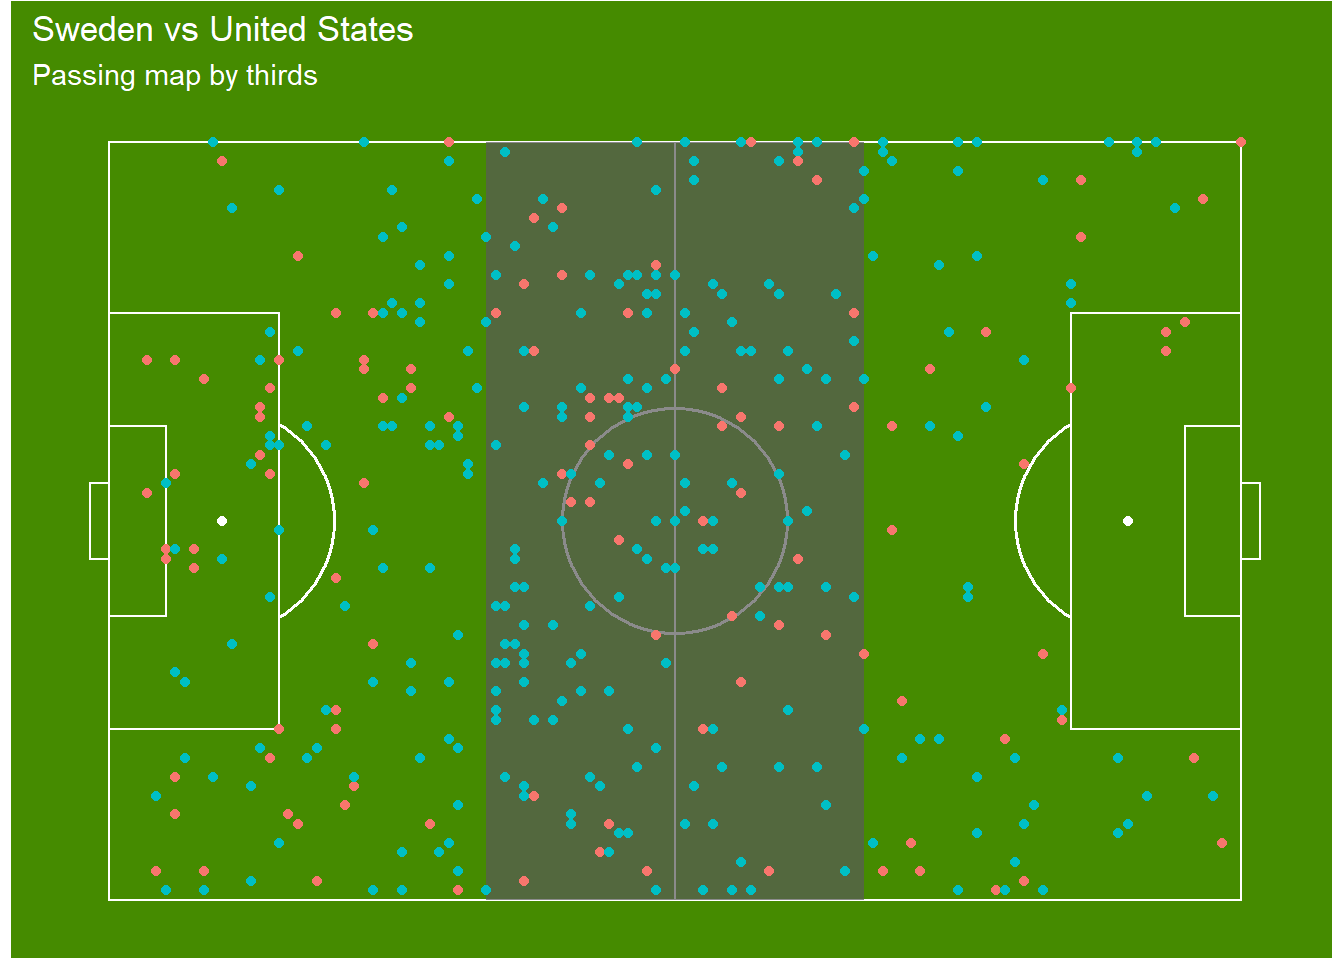
We can see that against the United States, maintaining possession all over the pitch was challenging. A number of longer passes were attempted from their first third, whilst the final third was challenging to break in to. The Canadian defence will offer a similar challenge to Sweden, so this will be key to their success.
The Netherlands
The Netherlands topped Group E, with three wins from as many matches. They started off shaky against New Zealand, but found their feet against Cameroon and then came out on top against Canada. However, they haven’t been convincing and with Japan waiting for them in the last 16, this will be anything but easy for the Dutch. Here is a summary of their tournament so far.
| match_date | Goals | xG | Total Shots | Shot On Target | Total Passes | Pass Completion |
|---|---|---|---|---|---|---|
| 2019-06-11 | 1 | 1.84 | 16 | 9 | 725 | 83% |
| 2019-06-15 | 3 | 1.08 | 9 | 6 | 522 | 76% |
| 2019-06-20 | 2 | 1.47 | 8 | 5 | 444 | 74% |
| 2019-06-25 | 2 | 1.52 | 11 | 11 | 606 | 81% |
| 2019-06-29 | 2 | 1.00 | 20 | 15 | 501 | 83% |
| 2019-07-03 | 1 | 0.72 | 16 | 9 | 644 | 74% |
| 2019-07-07 | 0 | 0.12 | 6 | 4 | 415 | 67% |
| a Table 2: Summary of The Netherlands throughout the group stage |
Where they appear to have struggled is creating meaningful shooting opportunities. Even though they scored 3 against Cameroon, they only had 9 shots in total. So let’s look at some of their passing in the final third.
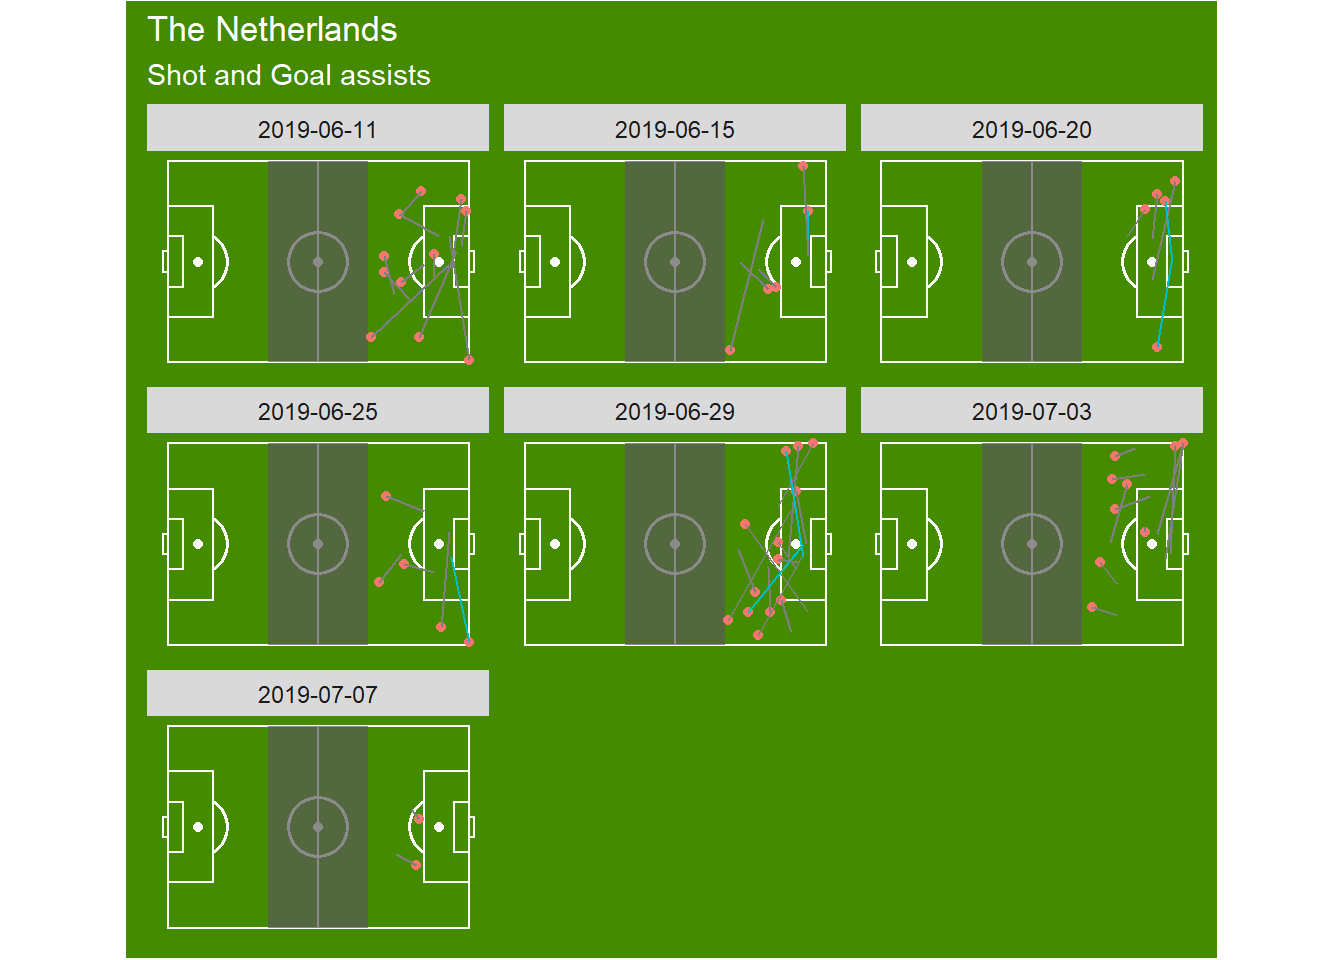
We can see above, that Netherlands created a number of shooting opportunities in their first match, but none of them created a goal. Whilst, the fewer opportunites they created in their last two matches where more effective for creating goals. It appears that for the Netherlands, assists where the final ball is played in or around the six yard box is more likely to create a goal. For them to beat Japan, more of these types of passes will be required for them to come away with the win.
Japan
| match_date | Goals | xG | Total Shots | Shot On Target | Total Passes | Pass Completion |
|---|---|---|---|---|---|---|
| 2019-06-10 | 0 | 0.24 | 8 | 3 | 713 | 85% |
| 2019-06-14 | 2 | 1.73 | 18 | 13 | 509 | 84% |
| 2019-06-19 | 0 | 0.67 | 16 | 6 | 517 | 82% |
| 2019-06-25 | 1 | 0.91 | 12 | 7 | 526 | 79% |
| a Table 2: Summary of Japan throughout the group stage |